Author Archives Laura Arnold

Sierra Club: AEP income-guarantee plan for Ohio powerplants could cost ratepayers $2.5 bil

Posted by Laura Arnold  /   September 29, 2015  /   Posted in Uncategorized  /   No Comments

New AEP projections show 'drastic' losses for Ohio customers in income-guarantee proposal, Sierra Club says

New forecasts by American Electric Power Company Inc. show the company’s income-guarantee plan for most of its Ohio power plants could cost ratepayers nearly $2.5 billion through 2024, according to the Sierra Club.

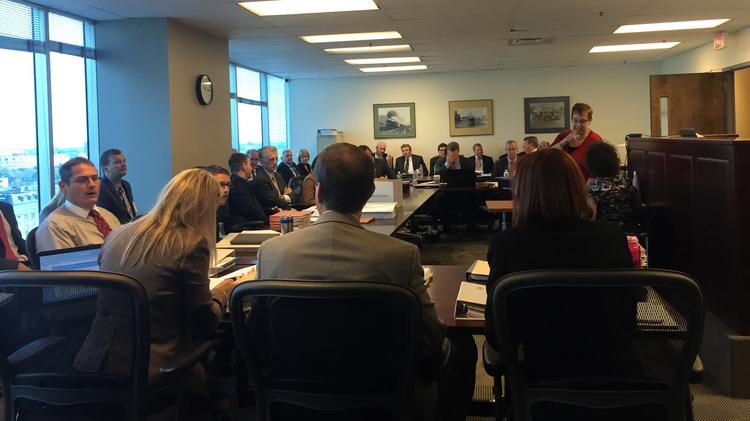
The environmental group’s attorneys tangled with the Columbus utility’s corporate counsel Monday morning at the Public Utilities Commission of Ohio to get its expert's testimony on AEP's 2015 market price projections into the record.

Until now, AEP’s latest projection was from 2013, predicting ratepayers would benefit to the tune of $574 million to $770 million.

But Sierra Club attorney Kristin Henry said AEP has been hiding updated price projections – she used the term “sandbagging” – that reflect far more costs for AEP Ohio’s ratepayers. Henry said AEP (NYSE:AEP) knew it had an updated model when asked about it in April.

“They sat on this information for five months,” Henry said at the hearing.

AEP attorney Steve Nourse bristled at suggestions the company was being less-than-truthful. The projections were not completed yet in April, he said, and AEP’s counsel was not aware of its existence until late August. The company provided the projections to the Sierra Club and other interested parties on Sept. 1.

Nourse said the Sierra Club expert Paul Chernick's testimony is not based on modeling and isn’t substantive analysis. He said Henry was being dramatic and hyperbolic, and AEP had no bad intentions.

“The fact is it’s not compelling evidence that the commission needs to hear,” he said.

The PUCO attorney examiners took a brief recess before deciding to allow the testimony, which was filed on Friday, after a Sept. 11 deadline.

The new information could be a boon for opponents of AEP’s power purchase agreement proposal, which would keep open 3,100 megawatts of the company’s Ohio coal-fired power plants that aren’t competing on the open market. AEP, like Akron utility FirstEnergy Corp.(NYSE:FE), say they want the agreements because Ohio needs fuel diversity and a hedge against up-and-down pricing.

“It’s drastic,” Henry said during a break in the hearing.
AEP’s worst previous prediction projected a ratepayer loss of $927 million. The Sierra Club’s witness testimony said that could quadruple to $3.8 billion. More in-the-middle projections from the Sierra Club put the losses between $1.8 billion and $2.4 billion.
The new projections last until 2024. AEP wants the contracts to last for the life of the plants, which vary in length but are all further out than 2024. A centerpiece of the argument is whether future energy prices will make a long-term agreement a benefit or burden to ratepayers, who are taking on all the risk of the agreement if it's approved.
AEP Ohio Spokeswoman Terri Flora said the Sierra Club doesn't consider "the many variables which ultimately impact the price of electricity and the profitability of AEP's generating units" in the regional grid in which it operates. "They are focusing only on a ultimate worst-case scenario, which is a highly unlikely outcome," she said in an email.
The updated projections are a lot different than just two years ago – the energy market is anything but staid, as fracking's recent boom-and-bust cycle demonstrates.
AEP projects a 20 percent drop in natural gas prices and higher capacity prices than it did in 2013. A big part of the company’s argument had been that prices for natural gas – a major contributor to the decline in coal – would only go up.
The Office of the Ohio Consumers’ Counsel, the state’s residential customer advocate, and the Retail Energy Supply Association also supported allowing the testimony.
“This is important information and it should come into the record,” said Howard Petricoff, a Vorys Sater Seymour and Pease energy attorney representing the retail energy group.
AEP Ohio President Pablo Vegas was the first witness at the hearing, which is expected to last weeks.

Indiana US Sen. Dan Coats calls Federal Wind Tax Credit a Double Financial Hit; Do you agree?

Posted by Laura Arnold  /   September 28, 2015  /   Posted in Federal energy legislation, wind  /   1 Comments
Indiana US Senator Dan Coats
 

Coats Highlights Waste of the Week: Expensive Wind Tax Credit

WASHINGTON, DC – Senator Dan Coats (R-Ind.), the Chairman of the Joint Economic Committee, delivered his weekly “Waste of the Week” speech yesterday afternoon and highlighted the wind tax credit.

In his remarks, Coats highlighted how the wind tax credit is a double financial hit to taxpayers who both subsidize the operations of wind farms and purchase the very electricity produced by wind farms. Coats said that taxpayers could save $10.5 billion over the next decade if Congress does not extend the wind tax credit.

Congress passed the Energy Policy Act of 1992, which included the Renewable Electricity Production Tax Credit. For wind producers, this tax credit could only be claimed if a wind farm was making power. While this subsidy was intended to be a short-term boost to help these new energy sources become competitive–the original credit was intended to last only five and a half years–Congress has instead repeatedly extended the credit.

Coats said, “In 2013, nearly two decades after the time which the subsidies were to expire, Congress changed the rules so that facilities only have to begin construction before the expiration date to automatically qualify for a future ten-year subsidy. This is true even before they become operational. In other words, just pour some concrete or place some steel, and then you qualify for the taxpayer subsidy.”

He continued, “The result is that more and more wind facilities are being constructed, irrespective of the needs of our electricity grid or market demand.”

In 2014, Congress retroactively extended the wind tax credit at the end of the year. It is likely that Congress will extend the production tax credit once again this year.

Click here to watch Coats speak on the Senate floor about this issue.


If you disagree with Sen. Coats, please contact him at: http://www.coats.senate.gov/contact/ 


Midwest Energy News: Michigan lawmakers, utilities attempt to settle value of solar debate

Posted by Laura Arnold  /   September 28, 2015  /   Posted in solar, Uncategorized  /   No Comments

2009 Solar Decathlon

Michigan lawmakers, utilities attempt to settle value of solar debate

WRITTEN BY 

PHOTO BY

After a variety of stakeholders — from utilities to environmental groups — spent the past year and a half trying unsuccessfully to reach consensus in Michigan over the value of solar energy, some Republican lawmakers are looking to end that debate themselves.

In December 2013, the Michigan Public Service Commission directed its staff to convene a Solar Working Group among dozens of energy policy stakeholders to, among other aspects, figure out a statewide value of solar for net metering customers.

When commission staff issued their report on July 1, 2014, there was no consensus within the group (which involved 76 people over four months) over that value, or how net metering programs should be structured going forward.

Roughly a year later, Senate Republicans, who hold a supermajority in the upper chamber, have taken it into their own hands to effectively settle that debate with the net metering       provisions in SB 438.

“Since we’re opening energy policy, we said, ‘OK, let’s try to resolve it. Let’s get it done,’” said state Sen. Mike Nofs, chairman of the Senate Energy and Technology Committee.

The resulting proposal — which values solar generation closer to wholesale rates than retail — is not a middle ground among the stakeholders, but rather a decided agreement with utilities, solar advocates say.

And while one major investor-owned utility says the process should be settled by the legislature anyway, MPSC staff saw it playing out differently.

“Staff concludes that any (value of solar) calculation for a rate-regulated Michigan utility would likely be determined as part of a Commission case proceeding,” staff wrote in the 2014 Solar Working Group report.

David Harwood, DTE Energy’s director of renewable energy, said SB 438 “sets the value of solar where it should be” by accounting for saved fuel costs and new capacity that would keep the utility from having to buy it on the market.

“The right place to do this is with legislation,” Harwood said. “I challenge the view that the legislature is stepping in to solve it only in the sense that everything the MPSC does is under the direction of legislation.”

But some solar advocates who fundamentally disagree with the utilities’ valuation of solar are at least asking lawmakers to slow down and let the process play out through the MPSC, as it has been until now. States across the country are struggling with the same issue, they say.

“We don’t think there’s been enough fair evaluation or research about the supposed ‘subsidies’ that are placed on those net metering customers,” Sarah Mullkoff, the Michigan Environmental Council’s energy program director, said on a taping of a public radio show this month.

In addition to Senate Republicans’ net metering proposal, a bipartisan team of House lawmakers has introduced legislation that would expand net metering and create market-based values for energy generated, potentially muddying the issue politically. While similar legislation introduced last year never made it out of committee, the Senate has spent the past several weeks taking testimony on its proposal.

Who’s subsidizing whom?

At the heart of the issue is whether other ratepayers are subsidizing utilities’ self-generating solar customers by avoiding costs for using the grid.

In its 2014 report, the MPSC said this should be studied further:

“The topic of net metering programs impacting non-participating customers has been discussed in other states recently. Many of these states have commissioned solar valuation studies to assess the impact of solar programs on non-participating customers. Without a similar study focused on Michigan's specific utility rates, avoided costs and solar generation profiles, it is not possible to know the extent of a net metering subsidy.”

While utilities say it is an issue of fairness — solar customers on average avoid about two-thirds of costs on their bills, they say — neither Consumers Energy nor DTE can say how much the current subsidy is per month for the average non-solar customer.

Solar advocates argue that it is much smaller than utilities claim, or in some cases that net metering customers provide a net benefit to the grid.

“If you unpack it and look at the value of solar, I’d say current retail rates are rough justice,” said Douglas Jester, principal with Lansing-based 5 Lakes Energy and a participant in the MPSC’s Solar Working Group. “It’s become pretty close to being without a subsidy.

“We’re underpaying solar on the power supply side. On the other hand, it’s true that people with solar using the grid to balance out their needs are making use of the grid. The two effects basically wash out. The numbers we’re paying people for solar now do not represent a significant cross-subsidy because those two factors tend to cancel each other out.”

Nofs and utilities say at this point the change is a principled stance against subsidies, agreeing that it is likely small when spread across the customer base.

“I don’t want to pay someone else to make money — I don’t care if it’s 2 cents a month,” Nofs said. “Why would I do that?”

Nancy Popa, Consumers Energy’s director of renewable energy, said SB 438's approach to net metering is similar to one of the recommendations in the 2014 MPSC staff report: A “buy all, credit all” approach in which customers purchase electricity from the utility at retail and are then credited at the value of solar rate and the value of renewable energy credits. In SB 438, though, the value of solar rate is close to wholesale prices of power.

“In our response to the MPSC, we said that we appreciate all the time and thinking that went in here, but at this point in the stage of solar development, we believe the policy should be a little fairer and not have incentives in it,” Popa said.

Moreover, deciding the issue through the legislature means “the MPSC’s role isn’t really to debate it but make sure utilities implement it as written,” she said.

Consensus lacking

Clearly, getting a diverse group of stakeholders to agree on the true solar value or cross-subsidization has been arduous.

“It certainly at this point is a fairly confused situation,” Jester said. “What everybody is struggling with is that utilities want to hold a view that generation by others — whether it’s solar on rooftops or cogeneration at industrial plants — only brings value to the extent that it displaces fuel or the operating costs of power plants.

“Because of the transition we’re going through with both power supply and the grid, figuring out what is the real value and how to credit it without overpaying for it is an unsettled topic,” Jester added. “The legislature is trying to deal with it and they can’t reasonably expect to have a deep understanding of the issue — they don’t have time.

“It’s still a work in progress in front of the commission. There are activities going on in various places and none seem to be reflecting what the other is doing.”

Similarly, MPSC staff have not found consensus on finding a value of solar for Consumers' pilot community solar program or in standby rates, which are cost-of-service based and are intended to recover the utility’s costs for providing backup services when a distributed generator is not at full capacity. These largely apply to combined heat and power projects, but also for on-site solar.

MPSC staff have recommended yet another working group to find fair standby rates, according to MPSC staff testimony from a current rate case. The Solar Working Group, with a narrower focus on just the value of capacity in calculating a value of solar, is expected to release another report this week.

Why the rush?

There are also differing opinions on the urgency at which the net metering and value of solar debate should be settled. Some argue it should be done before federal tax credits end. Utilities say rooftop solar is on the verge of a breakthrough as costs continue to decline.

“We want to solve this cross-subsidization thing before it gets way too big and puts a significant burden on low-income customers,” Harwood said, adding that SB 438 expands the net metering cap on who can participate 10-fold, though paybacks are at a much lower rate. “This needs to get fixed so people are making an educated choice.”

Nofs said since the Legislature is taking up sweeping energy policy anyway, it might as well settle the net metering dispute while they’re at it.

“The rush is we’d like to have these bills on the governor’s desk by the end of the year,” he said. “Next year is an election year, which is not a good time.”

Later this week, Michigan’s smallest electric cooperative — after having reached its net metering capacity cap last year — will move to a system that largely mirrors what SB 438 has proposed statewide. That proposal has generated strong backlash from current and would-be solar generators in the Upper Peninsula.

Jester, of 5 Lakes, disagrees that there needs to be a rush to finalize a plan statewide. Right now, the amount of solar overall is “very small,” he said, and far below the current cap.

“Within a couple of years, it’ll generally be the case when people can own solar with an ordinary rate of return for less than the price of power,” he said. “I’m sure (utilities) are anticipating that when we hit the cap, there’s going to be significant customer pressure to raise the (net metering) cap.”

Union Twp (OH) establishes clean energy district; Melink Corp. plans to use PACE district

Posted by Laura Arnold  /   September 25, 2015  /   Posted in Uncategorized  /   No Comments

Union Twp establishes clean energy district

September 24th, 2015

By Kelly Doran
Editor

Union Township recently added a Property Assessed Clean Energy district, allowing businesses to make energy efficient upgrades and pay it off monthly over 25 years.

A PACE district is a special improvement district that any company can petition to join. It allows the company to make an energy efficient upgrade and pay it back on their taxes, said John McGraw, Union Township trustee.

Another advantage is that if the company sells their property, the new owners takes over the payments, McGraw said.

The energy investment will likely lower energy bills, and the savings companies have from this will likely pay for the cost of improvements, McGraw said.

“It’s just an avenue to help companies out if they choose to go this route,” McGraw said.

The township does not gain or lose anything by having a PACE district, McGraw said.

Melink Corporation was the main company that requested that the trustees approve a PACE district, which they did during the meeting on September 10, McGraw said.

Melink wanted the township to have a PACE district “to empower local businesses in investing in energy efficiency and renewable energy measures,” said Steve Melink, president.

He hopes this will help businesses invest the money they would have spent on energy on other things. Businesses could not get this long of a payback time with a conventional loan, he said.

Melink Corporation provides energy efficient HVAC, kitchen ventilation, solar photovoltaic and geothermal services. Energy efficiency is critical to Melink, so his company generates all the energy it uses with on-site solar panels and wind turbans.

Melink also plans to make improvements to his company’s campus, which he hopes will help show other companies how to utilize PACE.

“This is an easy, very convenient way to finance long term investments,” Melink said.

He plans to add more solar to the company’s campus and to upgrade lighting to light-emitting diodes. Melink hopes to start on both projects before the end of the year, he said.

Melink said he’s also already hearing from other interested local businesses who want to make energy upgrades. PACE districts are becoming more and more common, which is good for the businesses who utilize it and for Melink’s company, he said.

The great guessing game: How much net metering is left? Indiana not even close to net metering cap

Posted by Laura Arnold  /   September 24, 2015  /   Posted in Uncategorized  /   No Comments

The great guessing game: How much net metering is left?

 IndianaDG Editor's Note: Please visit the original articles to see the maps and their keys properly.

Weak reporting requirements for net metering in some U.S. states are needlessly creating murky market conditions for distributed solar PV and other renewables, a new study by EQ Research has concluded. On the other hand, in other states, strong reporting requirements have facilitated market transparency, benefiting consumers, installers and policymakers alike. The study, The Great Guessing Game: How Much Net Metering Capacity is Left?, describes net metering reporting requirements and practices in 13 U.S. states, and offers nine recommendations for improving such requirements and practices.

Net metering, a long-time foundational element of distributed solar economics, is available in 44 states and the District of Columbia. Opportunities and conditions in the distributed solar market largely depend on states’ policy frameworks, and state policy framework and market conditions can change quickly — as we recently have seen in Nevada, New Hampshire and New York. When a utility nears or reaches its aggregate net metering cap, the market for new distributed solar in that utility’s service territory can come to an abrupt halt. Therefore, understanding the future availability of net metering in a state is critical to project planning, investment, and decision-making for solar developers, customers and policy-makers.

7393030-nem-caps-2015

State Progress Toward Net Metering Caps

Utilities typically must report certain net metering data periodically, but reporting requirements and practices vary widely among U.S. states. Reporting this data provides useful insight to policymakers, regulators, developers, consumers, investors, researchers, reporters and others. However, the usefulness of net metering reports depends on the types of data reported, how frequently the data is reported, and in what format the data is provided. The Great Guessing Game: How Much Net Metering Capacity is Left? examines and compares reporting requirements and practices in 13 states with different levels of market maturity:  California, Delaware, Illinois, Kansas, Louisiana, Maryland, Massachusetts, Minnesota, New Jersey, New York, North Carolina, Utah and Virginia.

The study identifies several common components of net metering reporting:

  • Megawatt Cap. Some reports specify the utility’s aggregate net metering program cap, in megawatts (MW).
  • Cap Notification. Utilities in some states must notify state regulators and/or customers when they reach a certain level of aggregate net metering capacity.
  • Number of Net-Metered Systems. Some reports include the total number of active net-metered systems in the utility’s service territory.
  • Installed Net-Metered Capacity. Some reports include the aggregate capacity of all active net-metered systems in the utility’s service territory.
  • Pending Net-Metered Capacity. Some reports include the aggregate capacity of all pending or proposed net-metered systems in the utility’s service territory.
  • Bonus Data. Includes net-metered system data differentiated by time and customer sector.

In addition, the frequency and format of net metering reporting can significantly impact the usefulness of the data they provide. These variables include:

  • Reporting Scope. Some reports are specific to an individual utility, while others cover all utilities or suppliers collectively in a state.
  • Reporting Frequency. Some states provide reporting in real time or near-real time; others require or provide annual reports.
  • Data Lag. A time lag typically exists between the end of the period covered by a report and when that report is made available.
  • Accessibility. Some states provide reports on dedicated web pages; others provide them in obscure dockets.
  • File Format. Some reports are available as spreadsheets; others are provided as cumbersome text files.

Based on the findings of this study, the authors proposed nine ideal data and reporting practices for states and utilities to consider. These proposed ideal practices are especially important in states with large or burgeoning distributed solar markets. The full study and its recommendations are available here. We’ve also published an interactive map which details state progress toward aggregate net metering caps.

Interactive map reveals how much net metering capacity remains in all 50 states

How maddening is it to try to gauge how much net metering capacity remains in any given U.S. state? Multiply the answer by 50, and that equals a lot of frustration, confusion, and lost time. Happily, EQ Research has created a new resource that reveals how much net metering capacity remains in each U.S. state under its current policy. This new resource serves as a companion to a related study published earlier this month by EQ.

For each of the 44 states that has established a net metering policy, the new interactive U.S. map indicates: (1) if an aggregate cap exists, (2) a description of how the cap is calculated, (3) the percentage of the cap met thus far with installed systems, and (4) the percentage of the cap met thus far with installed plus pending systems (if data is available). The map incorporates the most recent data available from government and utility sources as of August 2015.

Fifteen states have firm aggregate caps for net metering, while 12 states have a cap that may be enforced — or expanded — at the discretion of state regulators. The most recent data available indicates that eight states have exceeded 50% of their aggregate cap when considering installed systems only: California, Idaho, Louisiana, Maine, Massachusetts, Oregon, Vermont and Washington. Taking into account installed plus pending net metering applications (where data is available), 11 states have surpassed the 50% threshold.

NEM Aggregate Caps

For example, taking into account installed net metering systems only, Oregon has reached 213% of its cap (which is discretionary). At the other end of the spectrum, Illinois has reached less than 1% of its cap. Louisiana has met 88%, and Maine has reached 77%.

A related EQ Research study concluded that weak reporting requirements for net metering in some U.S. states are needlessly creating murky market conditions for solar PV systems and other distributed renewables. The study found that the usefulness of net metering reports depends on the types of data reported, how frequently the data is reported, and in what format the data is provided. Better reporting practices could easily improve market transparency, benefiting consumers, installers and policymakers alike.

The Great Guessing Game: How Much Net Metering Capacity is Left? examines and compares reporting requirements and practices in 13 states with different levels of market maturity: California, Delaware, Illinois, Kansas, Louisiana, Maryland, Massachusetts, Minnesota, New Jersey, New York, North Carolina, Utah and Virginia. Based on the findings of the study, the authors proposed nine ideal data and reporting practices for states and utilities to consider. These ideal practices are especially salient in states with large or burgeoning distributed solar markets.


The Great Guessing Game: How Much Net Metering Capacity is Left? A survey of current state reporting requirements and recommendations for improving DG market transparency

Download the full report HERE> NEM-Cap-Reporting-09_01_15


Date compiled by IndianaDG shows that the net capacity left for Indiana investor owned electric utilities ranges from 1-8.5% of the 1% cap with a statewide average of 5%. The net metering cap is 1% of the utilities summer peak load.

To receive a copy of this information and how it was calculated please email Laura.Arnold@IndianaDG.net. 

Copyright 2013 IndianaDG